Standard Curve
The Standard Curve tab is available for endpoint experiments with standard curve information entered. See how to enter standard curve info here.
Number |
Element |
Description |
|---|---|---|
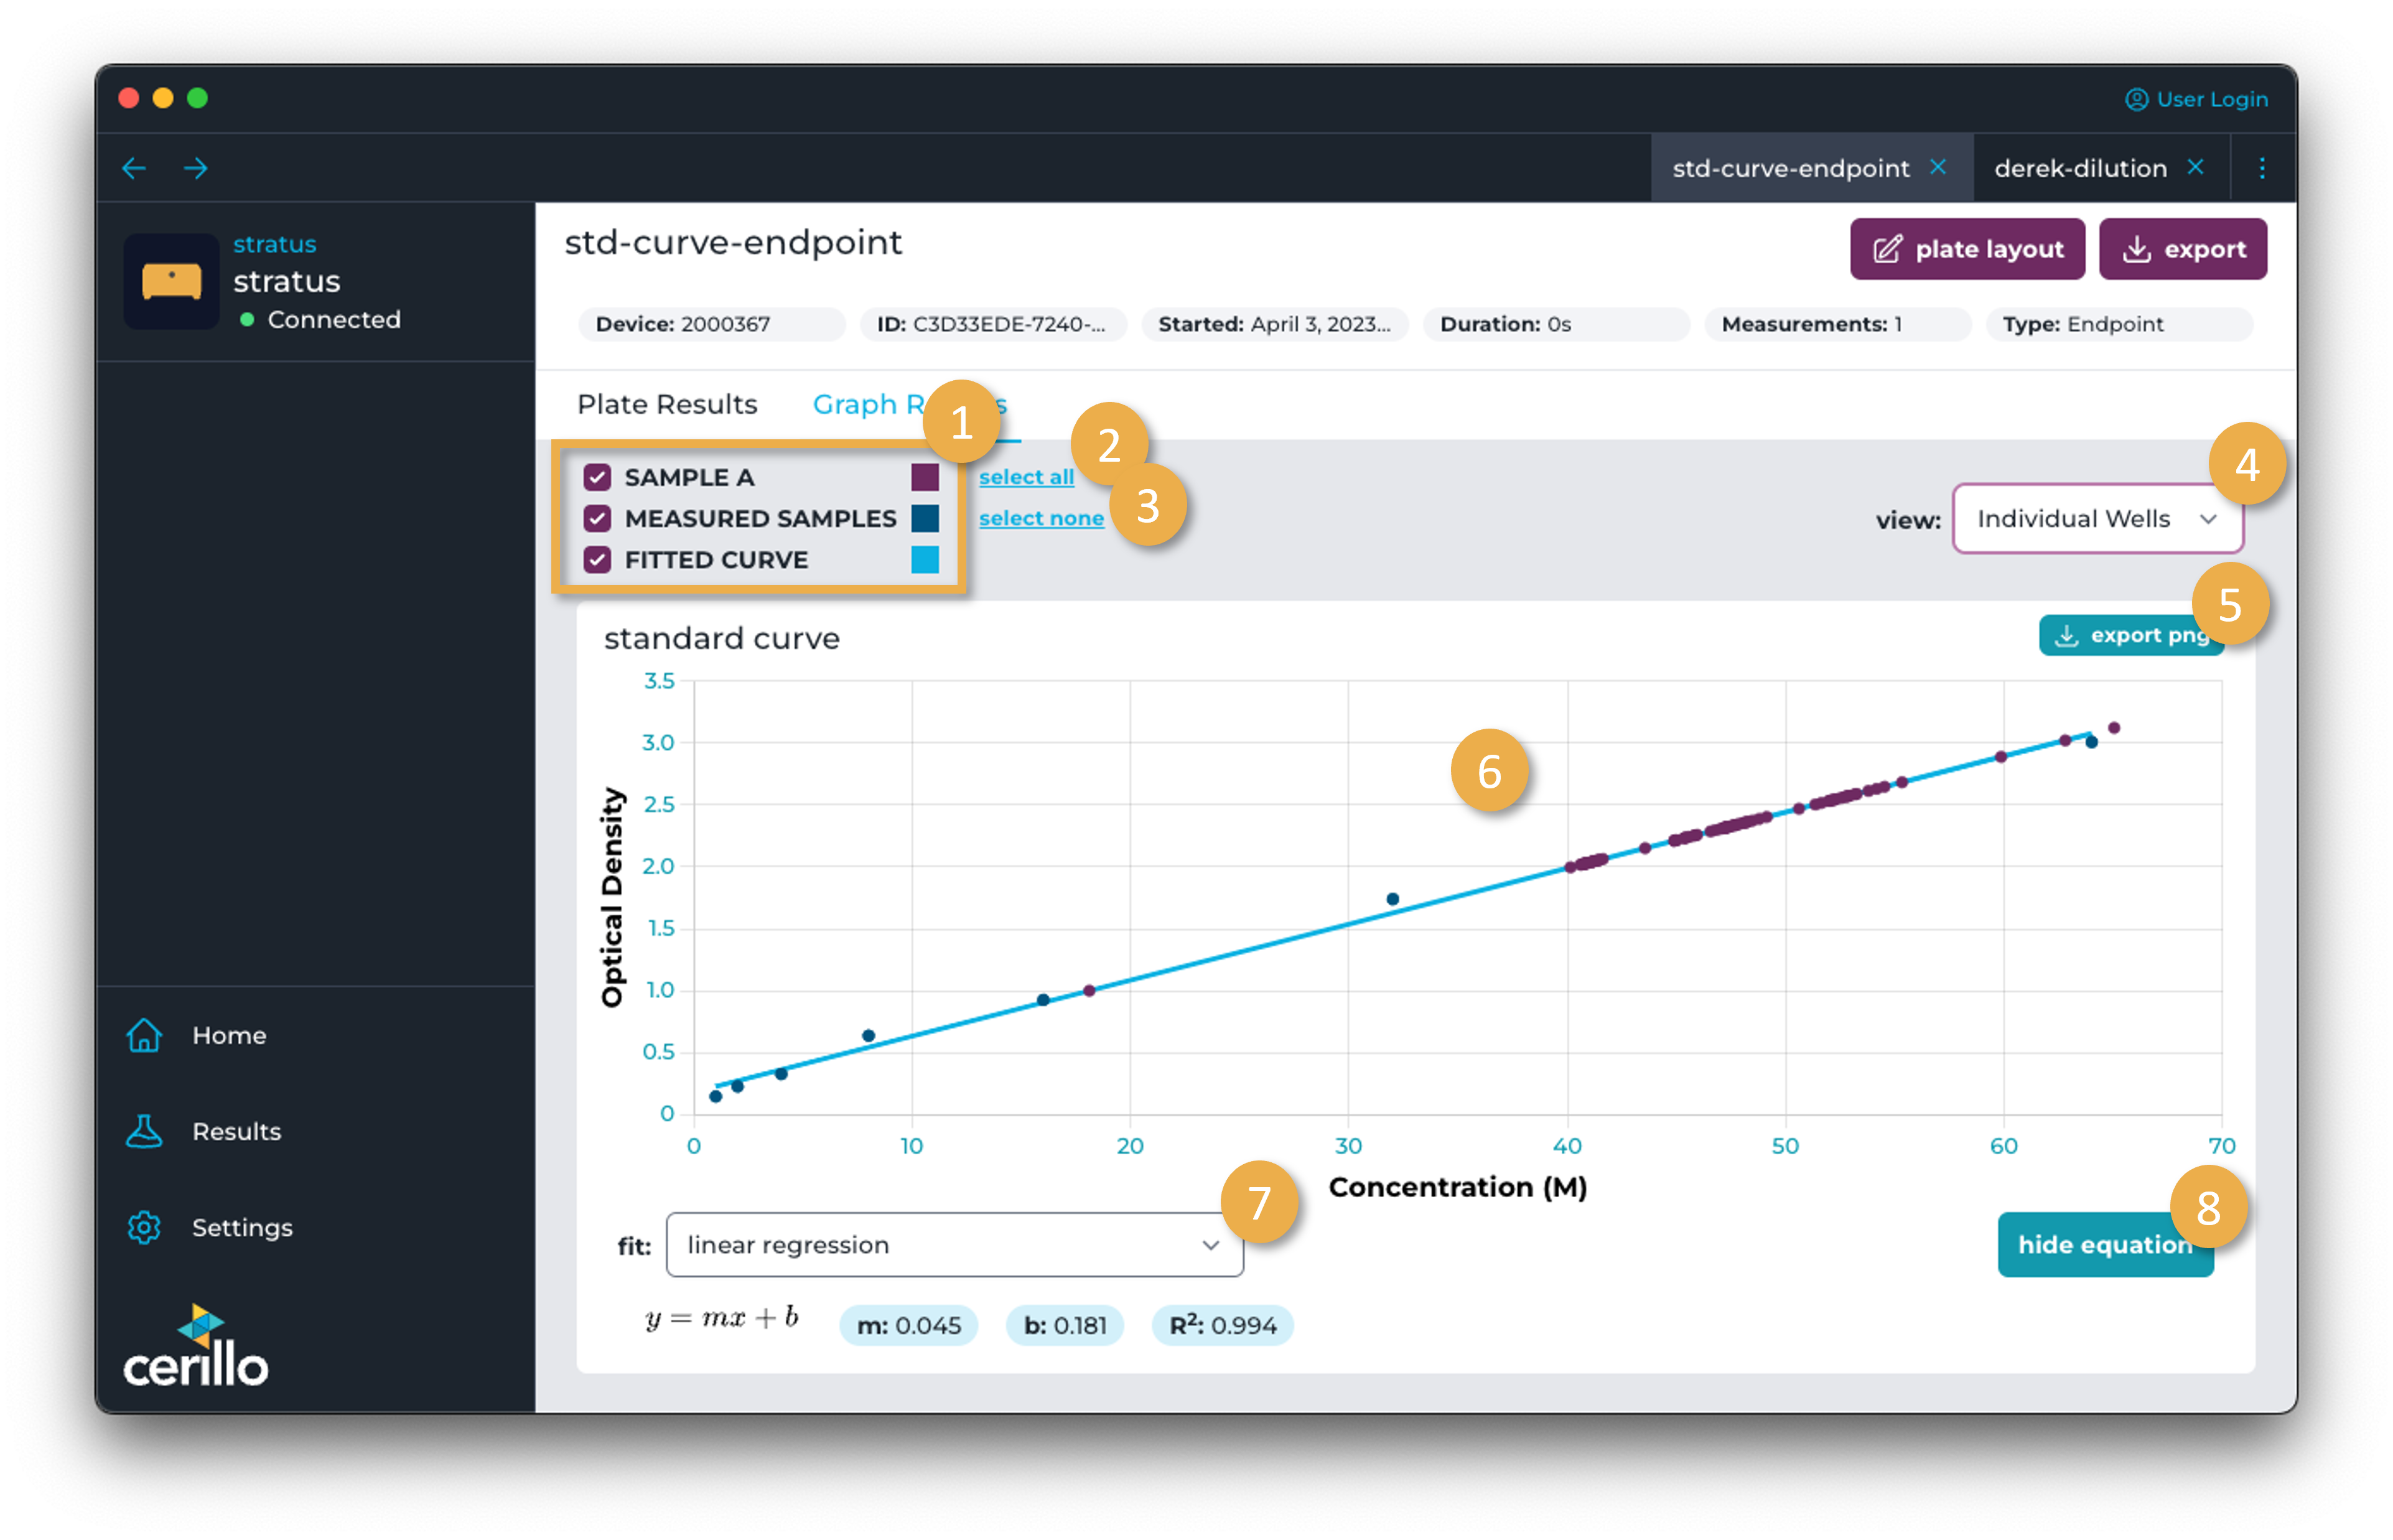
1 |
Group Visibility Toggle |
Click the checkbox for a group to toggle its visibility in the graph. Wells not assigned to a group can be viewed with the UNGROUPED toggle. |
2 |
Select All |
Toggle all groups to be visible on the graph. |
3 |
Select None |
Toggle off visibility of all groups. |
4 |
View Select |
Toggle between Group Average of the wells assigned to a group or Individual Wells to see each well plotted |
5 |
Export Graph |
Export the graph as a |
6 |
Standard Curve Graph |
Measured samples are the samples with known concentrations entered in the Endpoint Plate Layout and their measured optical density. Those samples are used to calculate a standard curve using the model selected in the Fit Select. Unknown or blank groups are added to the graph with the concentration calculated from the equation for the standard curve. |
7 |
Fit Select |
Choose between Linear Regression and Four-Parameter Logistic Regression (4PL) as the model to fit the measured samples to an equation. This selection should persist the next time the experiment is opened on the same computer. |
8 |
Equation Visibility Toggle |
Click to show or hide the equation generated to fit the data. The R2 value denotes how well the curve fits the data with a value close to 1 being a good fit. |